Set up your project
Set up your project profile with its name, scope, project type and delivery stage.
- Open CRAFT sign-in. New customers without an account must select Create customer account first, then use Customer login. Evaluation participants use Demo user/CRAFT staff login with their approved email.
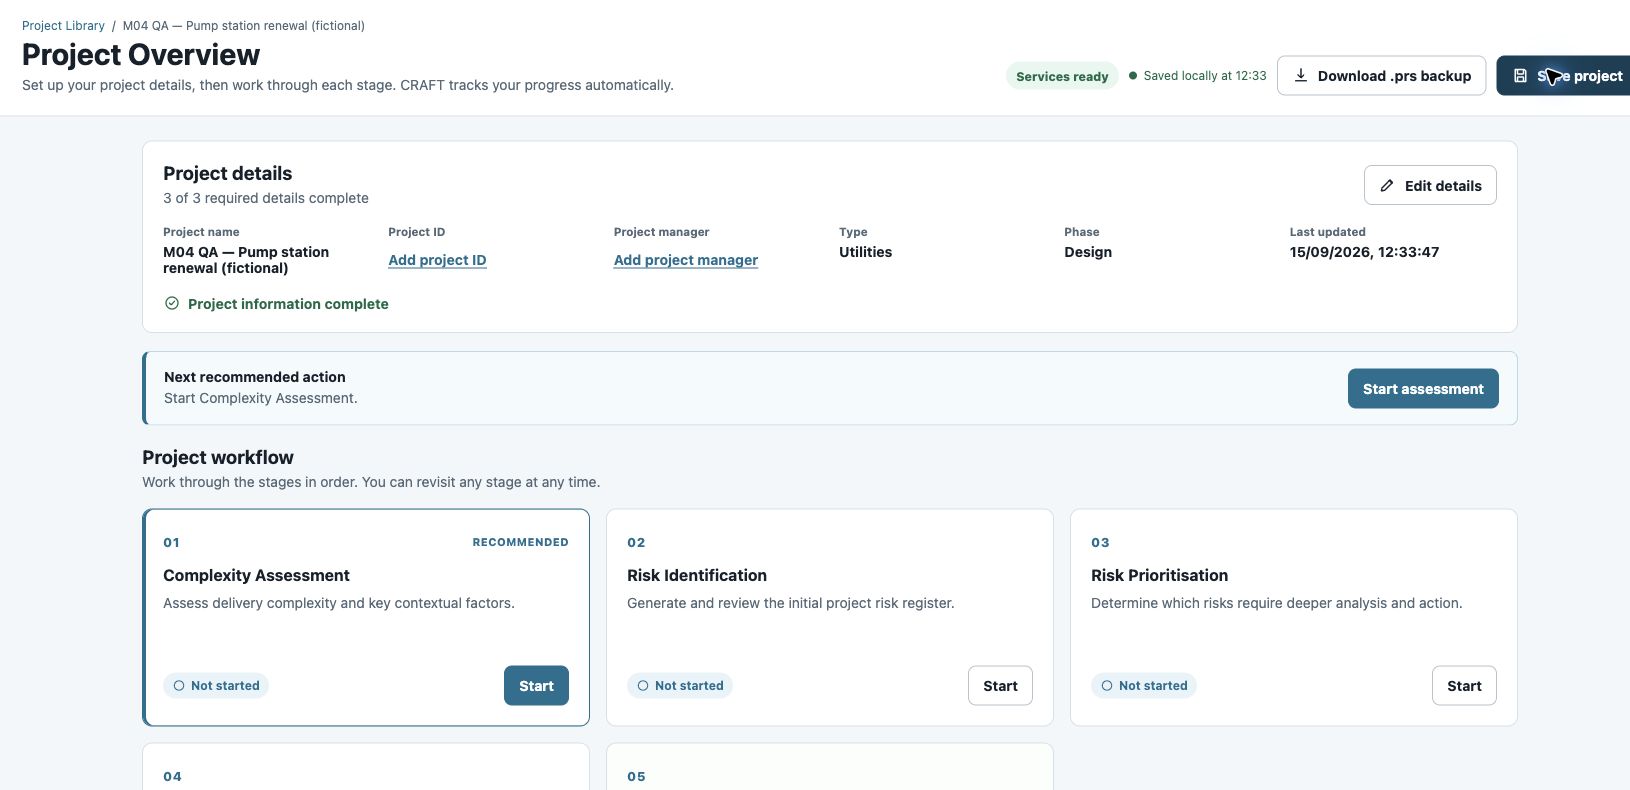
- In Project Library, select Create new project, name it Pump station renewal — practice, then select Create project.
- In Project Overview, choose Utilities and Design. Add the scope below and select Confirm project details.
Use the example project scope
Description / scope
Use the left navigation to move between functions. Save project saves in this browser; Project Library lets you reopen it.
Keep a backup: Your saved project stays locally in this browser on your machine. Use Download .prs backup to back it up or share a copy with others. PRS does not store a cloud copy of your project and cannot recover a deleted project without a .prs backup. Clearing browser data can also remove the local copy.
Check: The project name, type and phase are confirmed. Open Complexity Assessment next.
Finding your way around CRAFT
Project Overview holds project details and progress. The five Workflow links open the working modules. Risk Reports holds generated outputs. Configuration manages rating and category profiles; keep the defaults for this exercise.
Reading this guide needs no account. Practising in CRAFT needs active access. Use a fictional project while learning.
Assess project complexity
Identify where delivery needs closer attention before drafting the risk register.
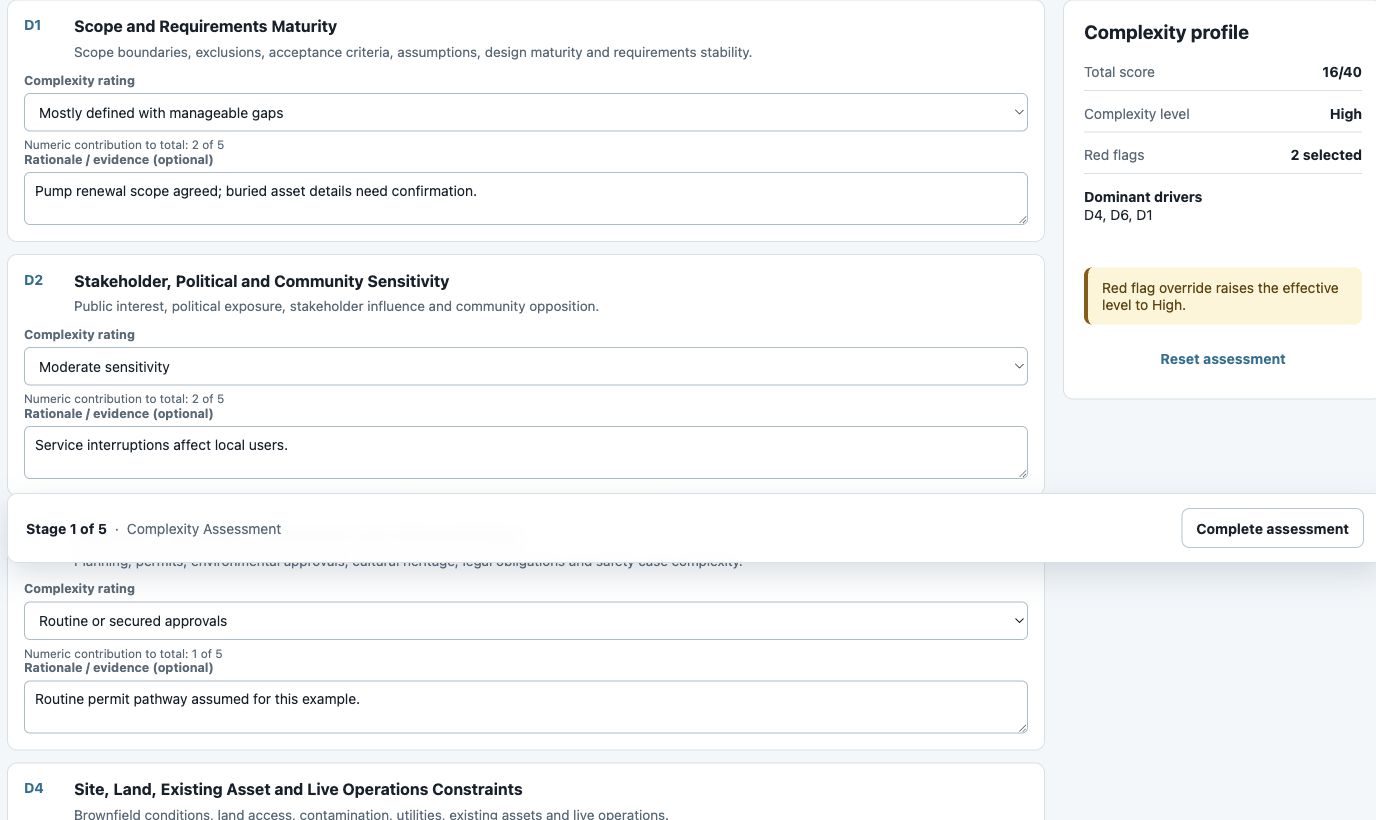
- Open Complexity Assessment. For D1–D8, choose a rating and add a short rationale.
- Review the Red flags. For this example, select Live operating environment and Land, property or latent conditions.
- Review the profile, then select Complete assessment to continue to Risk Identification.
Use the example ratings
| Factor | Example selection | Why |
|---|---|---|
| D1 | Mostly defined with manageable gaps | Pump renewal scope agreed; buried asset details need confirmation. |
| D2 | Moderate sensitivity | Service interruptions affect local users. |
| D3 | Routine or secured approvals | Routine permit pathway assumed for this example. |
| D4 | Significant brownfield or live interfaces | Pump station stays operational during construction. |
| D5 | Low novelty | Proven pumps and equipment. |
| D6 | Many interdependent interfaces | Telemetry and cutover depend on coordinated interfaces. |
| D7 | Adequate market with manageable exposure | Normal supplier market; lead times need checking. |
| D8 | Minor uncertainty or pressure with adequate governance | Funding assumed available; cutover window needs agreement. |
Check: These inputs give 16/40 and an effective High level because of the red flags. D4, D6 and D1 are the dominant drivers.
The profile guides risk identification; it does not calculate a contingency allowance. If you change project type or phase, revisit the assessment.
Identify and review risks
Turn project context and workshop notes into a structured risk register you can review and refine.
- Open Risk Identification. Select Use profile (recommended) to use the complexity assessment when drafting risks. You can select Continue without profile, but the engine will not use that assessment.
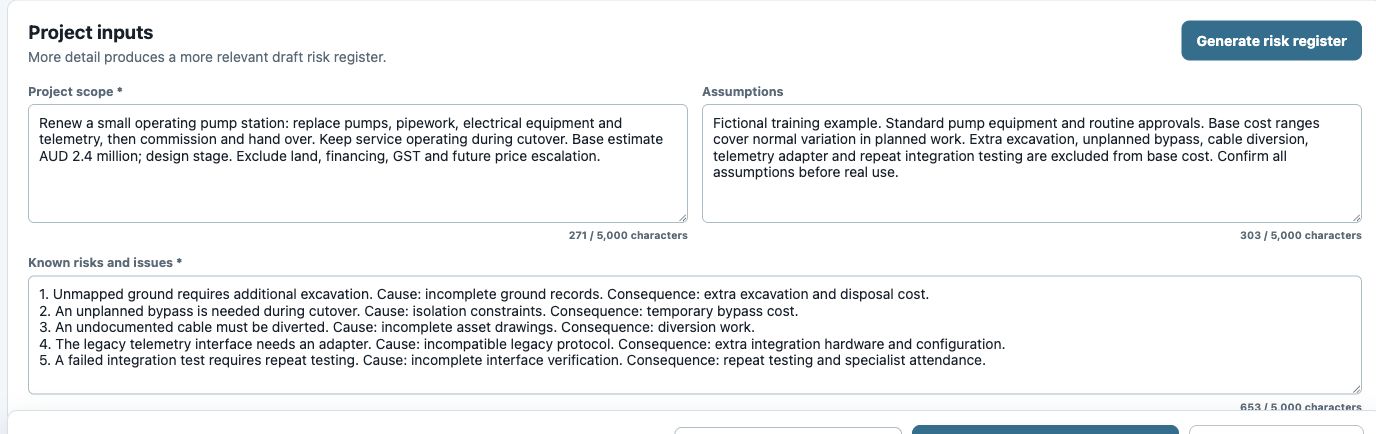
- Enter Project scope, Assumptions and Known risks and issues. Copy the example below, or use your own information.
- Select Generate risk register. Review the risk statements, causes, consequences and categories; edit weak wording and check for overlap. Use Add risk if something is missing.
- Choose Risk Prioritisation under Move risks to, then select the adjacent Move … risks button.
Use the example identification inputs
Project scope
Assumptions
Known risks and issues
Check: Look for duplicate or overlapping risks, incorrect categories, unsupported rationale and missing risks. Confirm that statements, causes and consequences fit the project information you provided.
The AI output is a draft for your review. Its Confidence value is not the probability of the risk occurring. It reflects the AI model’s confidence that the risk is relevant to your project, based on the clarity of your information and its fit with the scope and assumptions. Generation sends the entered context to the hosted AI service; use the supplied fictional text for practice.
If the draft needs work
Edit the fields directly. Keep causes separate from consequences and choose a category before transferring. If one of the five example events is missing, use Add risk and enter its statement, cause, consequence and category. Keep other useful risks for review; they do not all need a cost allowance.
If your complexity profile is out of date, use Review assessment and complete it again. If generation fails, preserve your inputs and check the displayed error before retrying.
Prioritise the risks
Agree which risks need attention using a consistent likelihood and consequence scale.
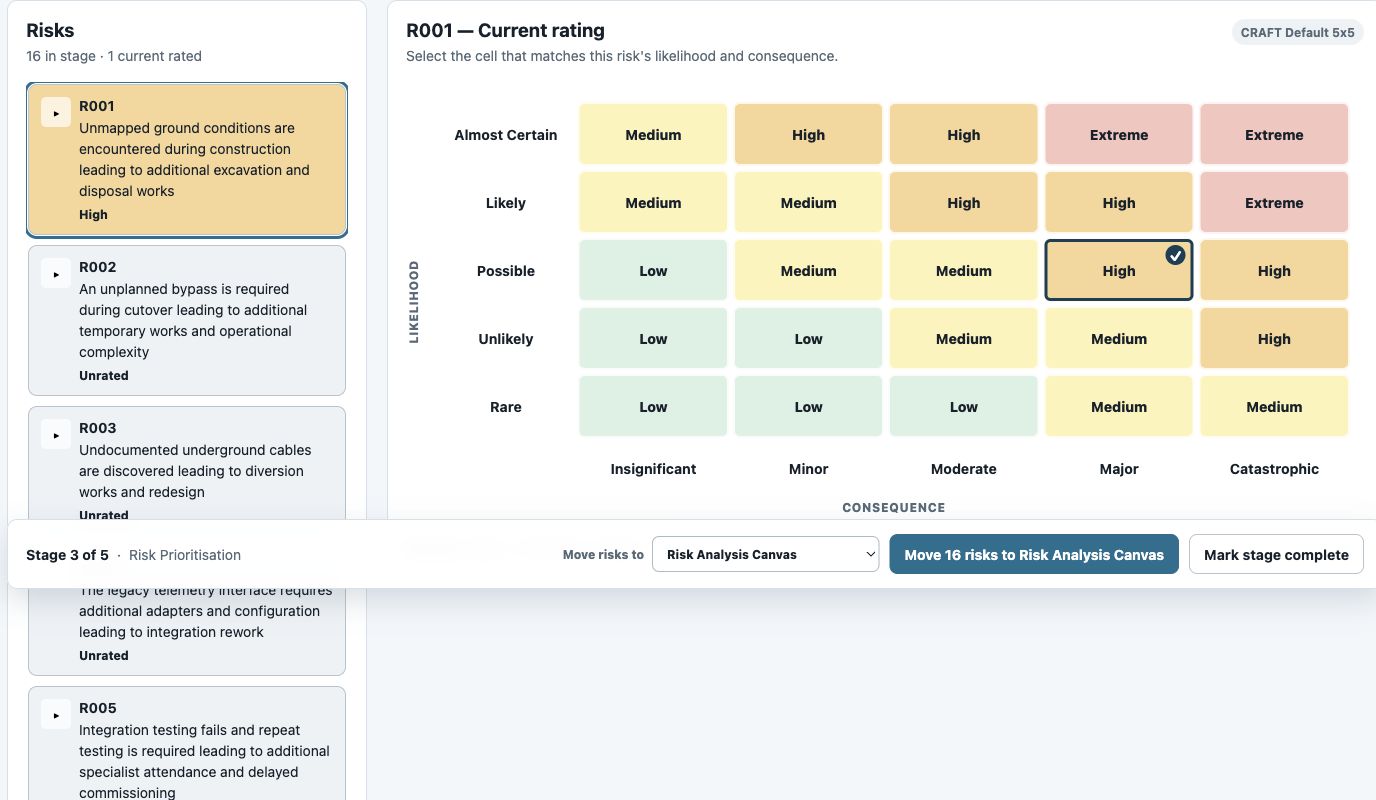
- In Risk Prioritisation, keep Current selected and check the Rating profile.
- Select the excavation risk in the left list. With CRAFT Default 5x5, click the matrix cell at Possible and Major.
- Discuss the other risks and rate them using the profile definitions. Expand a risk to inspect its causes and consequences.
- Choose Risk Analysis Canvas under Move risks to and select Move … risks.
Check: The example excavation risk shows High — Possible × Major. The risk ID stays the same when you move between stages.
You can explore Canvas after rating one risk; mark Prioritisation complete only after rating every risk in that assessment basis.
Plan controls and actions
Make the response clear: what causes the risk, what is already in place and who will do what next.
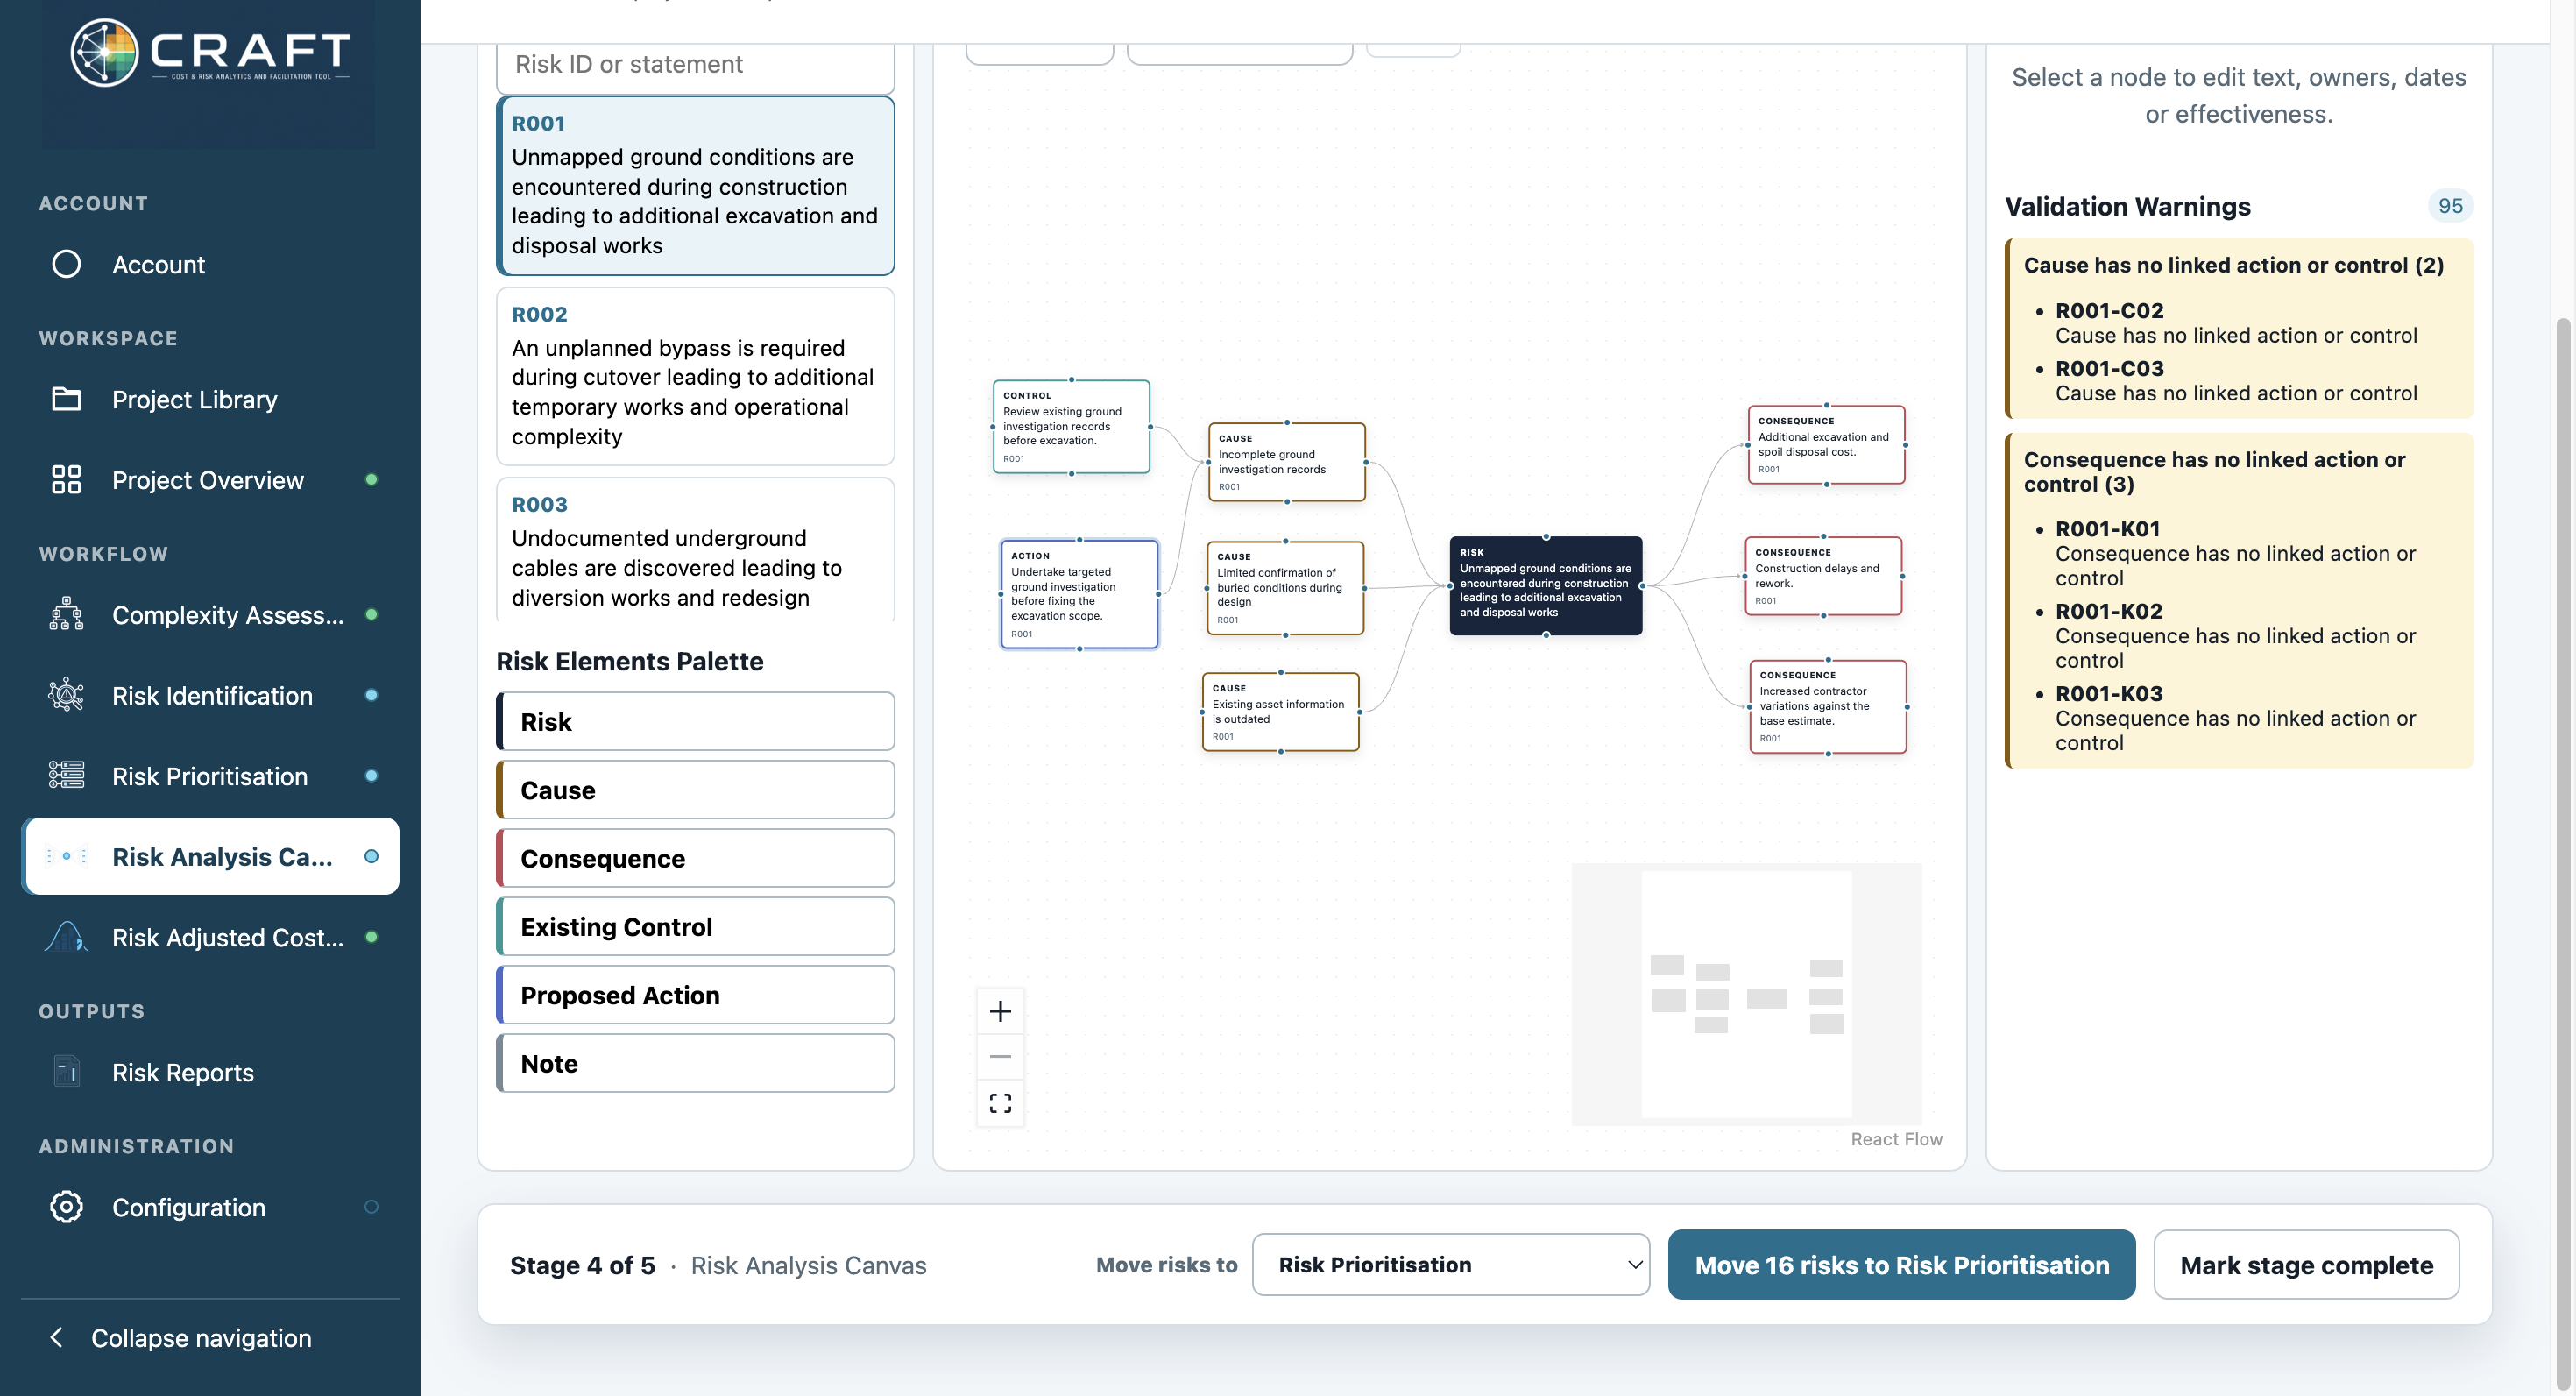
- In Risk Analysis Canvas, select the excavation risk. Its causes and consequences appear around the risk.
- Select Existing Control in the palette, then click the new node. Use Node Details to enter its text, owner, type and effectiveness.
- Select Proposed Action, click the new node and enter the action, owner, dates and status.
- Turn on Connect Mode. Drag from a small handle on the control or action to a handle on the cause it addresses. For this example, link both to the incomplete-ground-records cause. Turn Connect Mode off to move nodes; use Fit View to see the whole map.
- Review Validation Warnings for missing owners, effectiveness or connections.
Use the example control and action
| Element | Example entry |
|---|---|
| Control | Review existing ground investigation records before excavation. |
| Control details | Owner: Design lead · Type: Detective · Effectiveness: Partially effective |
| Action | Undertake targeted ground investigation before fixing the excavation scope. |
| Action details | Owner: Project manager · Start: 1 October 2026 · End: 8 October 2026 · Status: Not started |
Check: The control and action are connected to the relevant cause, and the action has an owner. Treat the remaining warnings as review prompts.
Compare current and residual risk
At the bottom of Canvas, choose Risk Prioritisation and select Move … risks. CRAFT opens the Residual assessment. For a hypothetical effective-treatment scenario, select the excavation risk and choose Unlikely × Major: the default profile gives Medium. Switch to Current to see the original High rating.
Build the base cost estimate
Separate uncertainty in planned work from the additional cost of risk events.
- Open Risk Adjusted Cost Estimation using the left navigation. For the first comparison, leave its Risk register empty; do not transfer Canvas risks yet.
- In Simulation Settings, use AUD, precision ±2% (slider fully left), maximum iterations 320000, seed 123456 and None (independent).
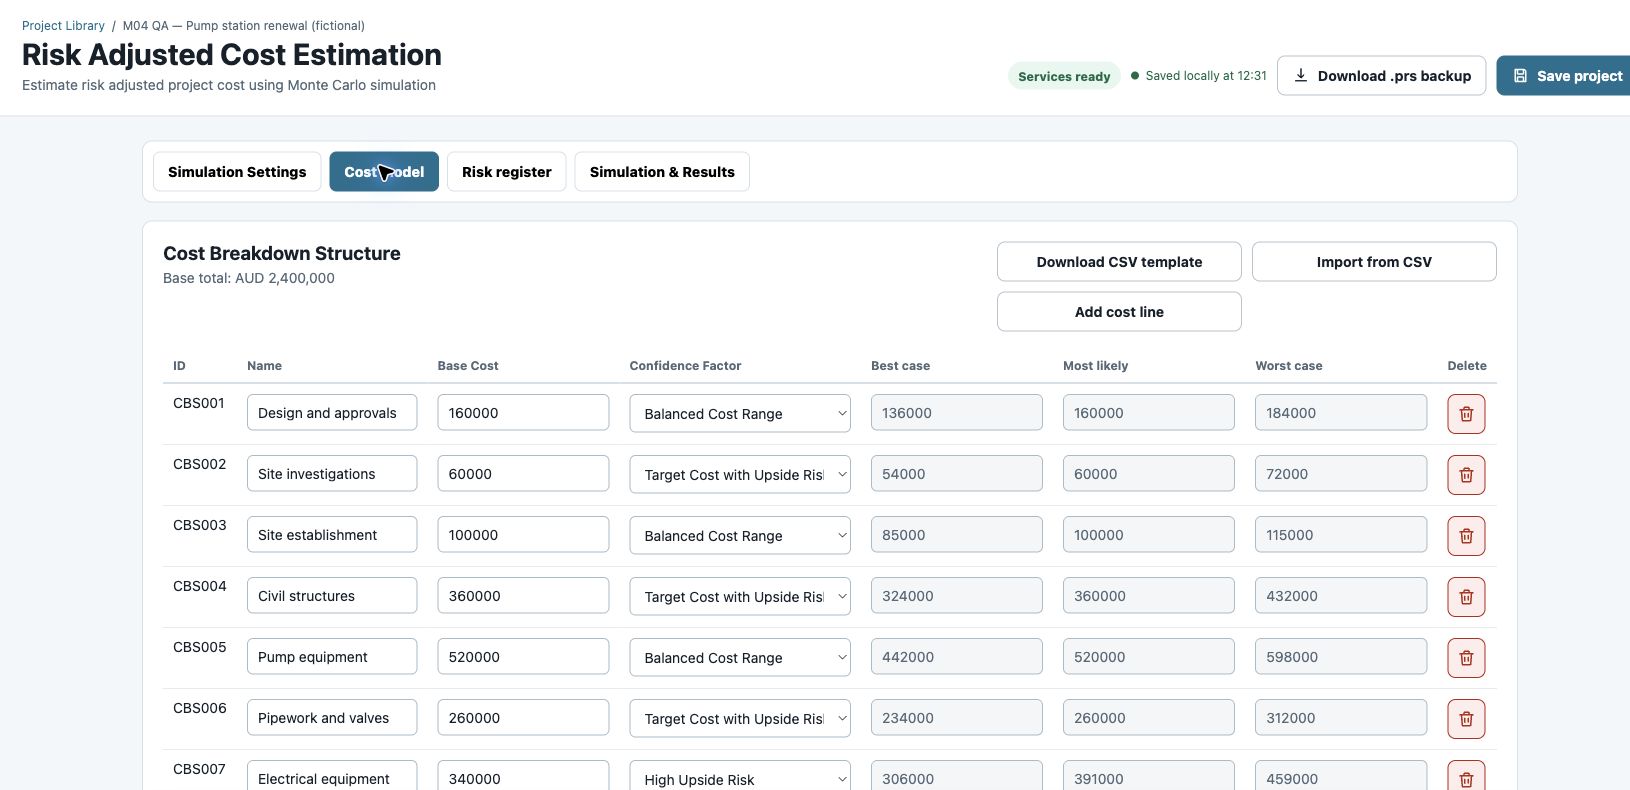
- Open Cost model. Rename the four starting rows and use Add cost line to create the remaining rows. Enter the supplied base costs and Confidence Factors.
- Open Simulation & Results and select Run simulation.
Enter the sample cost items
Copy one field at a time. Enter full dollar amounts without commas or currency signs.
| Cost item | Name | Base cost (AUD) | Confidence Factor |
|---|---|---|---|
| CBS001 | |||
| CBS002 | |||
| CBS003 | |||
| CBS004 | |||
| CBS005 | |||
| CBS006 | |||
| CBS007 | |||
| CBS008 | |||
| CBS009 | |||
| CBS010 |
Check: The base total is AUD 2,400,000. The reference cost-only run gives P50 AUD 2,474,016 and P90 AUD 2,549,751. Note these before changing inputs.
How the cost inputs work
A Confidence Factor converts each base cost into Best case, Most likely and Worst case. Balanced Cost Range uses 85% / 100% / 115%; Target Cost with Upside Risk uses 90% / 100% / 120%; High Upside Risk uses 90% / 115% / 135%. “Upside” means higher cost here.
This example does not use correlation. In real projects, costs can rise or fall together because of shared market drivers, such as labour or material prices. Use correlation where those links exist: choose Standard (recommended) in Simulation Settings, then set each cost item’s Correlation factor and Sensitivity. Keep unrelated items independent. A convergence target controls simulation sampling precision, not the quality of your estimate.
Bring risk events into the estimate
Connect the reviewed register to explicit probabilities and financial impacts without counting the same exposure twice.
- Return to Risk Analysis Canvas. Choose Risk Adjusted Cost Estimation under Move risks to and select Move … risks.
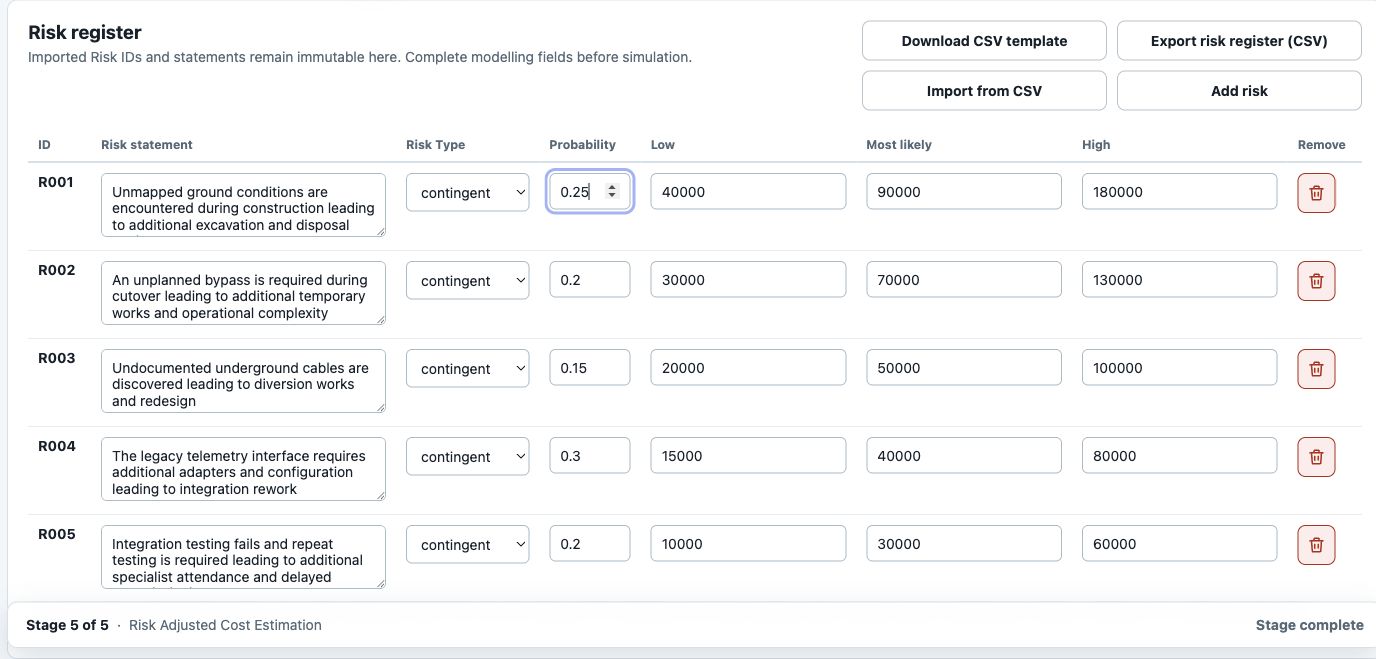
- Open the cost module’s Risk register. Find the five sample events below by meaning. Keep their existing IDs; do not add duplicates.
- For this bounded cost exercise, use Remove on other rows in the cost Risk register only. This excludes them from this simulation while preserving them in the project’s other stages.
- Set the five retained events to contingent. Enter their probability and Low / Most likely / High additional cost, then run the simulation again.
Enter the sample risk costs
Use 0.25 for 25%. The three impact values are costs if the event occurs; do not multiply them by probability.
| Risk | Risk statement | Probability | Low (AUD) | Most likely (AUD) | High (AUD) |
|---|---|---|---|---|---|
| R001 | |||||
| R002 | |||||
| R003 | |||||
| R004 | |||||
| R005 |
Check: Five contingent events remain in the cost register. Their impacts are excluded from the base ranges. The reference full-model P90 is AUD 2,661,710.
Removing a row here is different from Delete risk in Identification or Canvas, which removes the risk across the project. Do not mark a risk “inherent” merely to avoid estimating it.
Choosing which risks belong in a cost model
Contingent risks are events that may or may not happen and add cost if they occur, such as an unplanned bypass. Enter their probability and additional-cost range. Inherent risks are uncertainty within planned work, such as variable quantities or productivity, and drive the base-cost uncertainty. Reflect them in the cost item’s Confidence Factor or Best / Most likely / Worst case values. Selecting “inherent” in the risk register excludes that row from separate event-cost simulation; it does not automatically adjust the base-cost ranges.
Review overlaps: an aggregate “budget overrun” risk may repeat costs already modelled in individual events. The five-event example is a learning subset, not a complete project risk model. Moving Canvas risks again can re-add rows you previously removed from Cost.
Interpret results and test a response
Explain the cost range and which assumptions warrant further investigation.
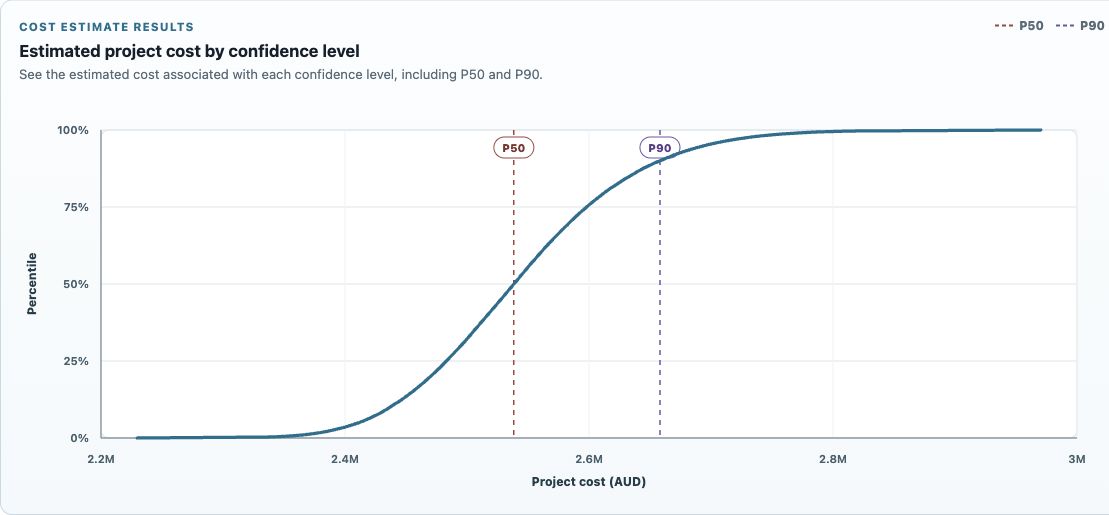
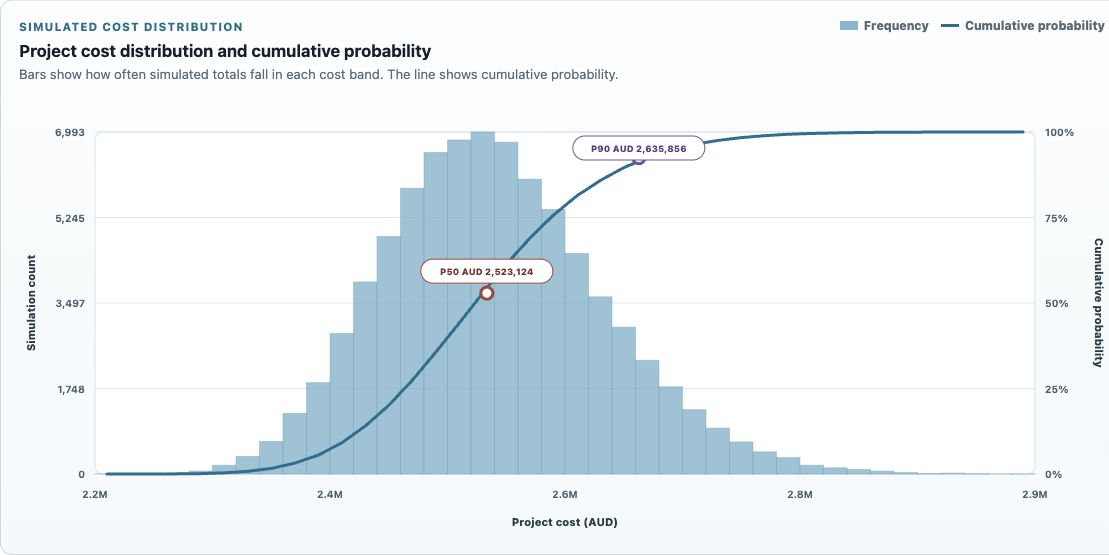
- In Simulation & Results, read P50, P90 and contingency. Open Distribution and choose Cost vs percentile for the S-curve, or Histogram to see how simulated costs are distributed across cost ranges. Open Sensitivity for the strongest cost drivers.
- Record the baseline. Change only the excavation probability from 0.25 to 0.10, keeping its impact range and all other inputs unchanged.
- Run again and explain the difference. Link the assumption to the investigation action discussed in Canvas.
Check: In the reference example, P90 falls by AUD 25,854. This is a modelled scenario difference, not a demonstrated saving; treatment cost and evidence of effectiveness still need review.
Compare the reference results
| Scenario | P50 (AUD) | P90 (AUD) | P90 − P50 (AUD) |
|---|---|---|---|
| Cost only | 2,474,016 | 2,549,751 | 75,735 |
| With five risks | 2,537,284 | 2,661,710 | 124,426 |
| R001 probability 0.10 | 2,523,124 | 2,635,856 | 112,732 |
P50 is the median modelled cost. P90 is the amount at or below which 90% of simulated outcomes fall under the assumptions. CRAFT’s displayed contingency is P90 minus P50, not P90 minus the base estimate.
The reference runs used the supplied five events in their listed order and converged at 80,000 iterations. Different inputs, ordering, settings or engine versions can change the figures. AI drafts do not have to match word for word.
If a result looks wrong
Check the base total, Confidence Factors, remaining cost risks, decimal probabilities, impact ranges, seed, precision and correlation settings. Run again after an edit: changing inputs clears the previous results.
Sensitivity shows association with total cost, not a share of contingency or proof of causation. P90 is not a guarantee that the real project will stay within budget.
Save your work and share outputs
Keep the analysis usable after the workshop and give reviewers an output they can inspect.
- Select Save project and wait for Saved locally. Return to Project Library, reopen the project and check a rating, a Canvas action and the cost inputs.
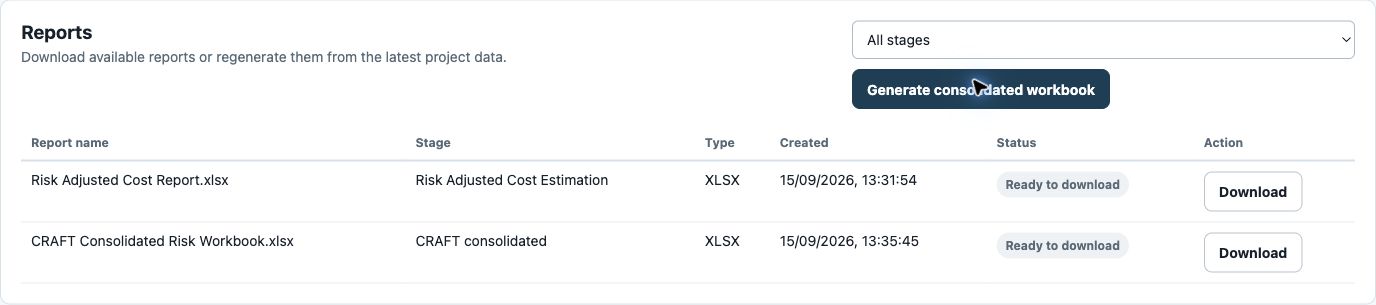
- Use Export Excel report in Canvas or Cost, or Export Excel register in Identification, for a module output. Open Risk Reports and select Generate consolidated workbook for a combined output. Use Download on a ready report, or Regenerate when CRAFT needs to rebuild it.
- After editing the analysis, generate a fresh report. A previously downloaded workbook does not update itself.
Check: You can trace a risk from its cause and rating through its action and cost assumption, reopen the project and identify the output you would share.
Projects are stored in this browser. Use Download .prs backup when you want a portable backup; clearing browser data can remove the local copy.
Before using this for a real project
Agree scope, rating criteria, owners and assumptions with your team. Configure your organisation’s profiles where needed. Review AI drafts and model inputs, resolve relevant Canvas warnings and document exclusions before issuing outputs.
A practice project may remain In progress when you have explored only selected risks. Completion indicators help track work; they are not assurance that the analysis is correct.